R6/2 Mice express the N-terminal fragment of the human huntingtin (HTT) protein with ~120 CAG repeats under the control of the human HTT promoter. Animals are a highly used model for the development of drugs against Huntington’s disease.
Mice present the following phenotype :
- 50 % survival at ~100 days
- Learning deficits at 10 weeks
- Motor deficits at 8 weeks
- Strong HTT overexpression at 12 weeks
- Strong neuroinflammation at 12 weeks
R6/2 mice have a mean survival of 15 weeks and show re-learning deficits at the age of 10 weeks (Figure 1).
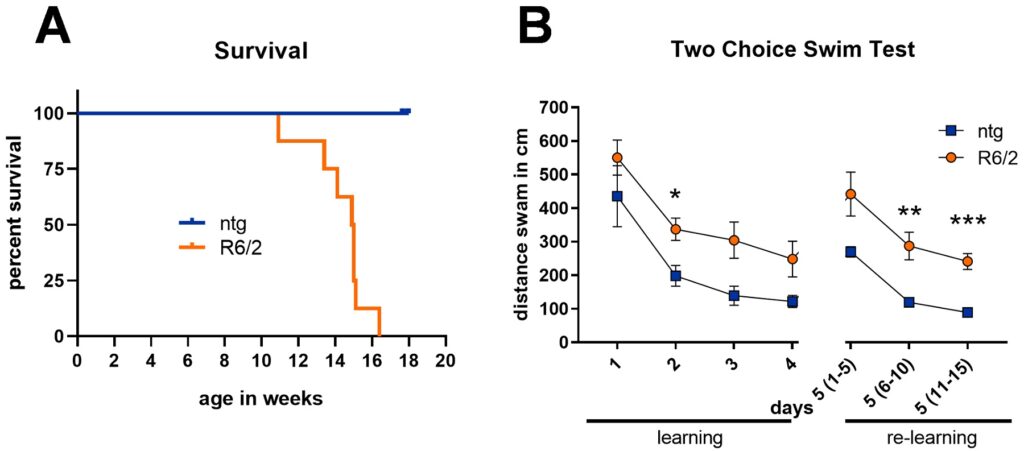
Figure 1: Survival and Learning Deficits in R6/2 Mice. A: Survival curve of R6/2 mice and non-transgenic littermates (ntg); n = 8/group. B: Two choice swim test of 10 week old R6/2 mice and ntg littermates; n = 15/group; Two-way ANOVA with Bonferroni’s post hoc test. Mean ± SEM. *p<0.05; **p<0.01; ***p<0.001.
All performed motor tests revealed strong motor deficits of R6/2 mice already at 8 weeks of age (Figure 2).
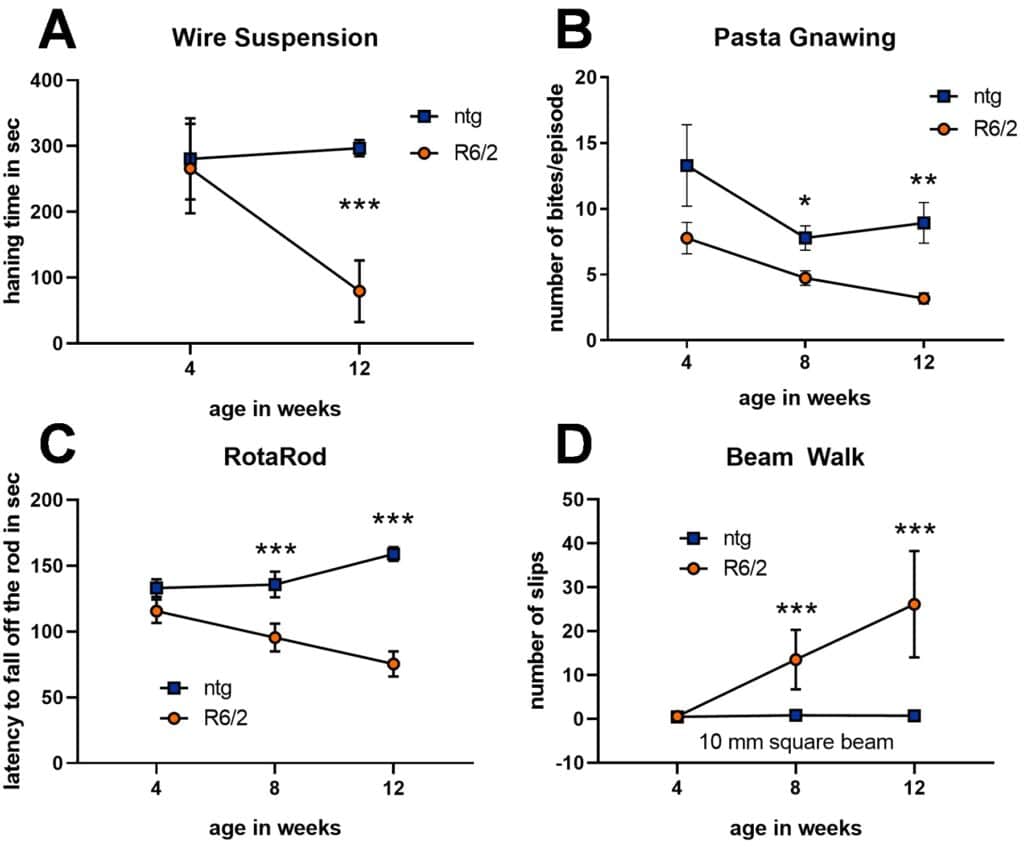
Figure 2: Motor Deficits of R6/2 Mice A: Hanging time in seconds in the wire suspension test of 4 and 12 weeks old R6/2 mice and ntg littermates; B: Number of bites per episode in the pasta gnawing test; C: Latency to fall off the rod in the RotaRod test; D: Number of slips on a 10 mm square beam of the beam walk test. B-D: 4, 8 and 12 week old R6/2 mice and ntg littermates. A-D: n = 15/group; Two-way ANOVA with Bonferroni’s post hoc test. Mean ± SEM. *p<0.05; **p<0.01; ***p<0.001. R6/2 mice show a highly increased huntingtin expression in the caudate putamen and hippocampus at the age of 12 weeks (Figure 3).
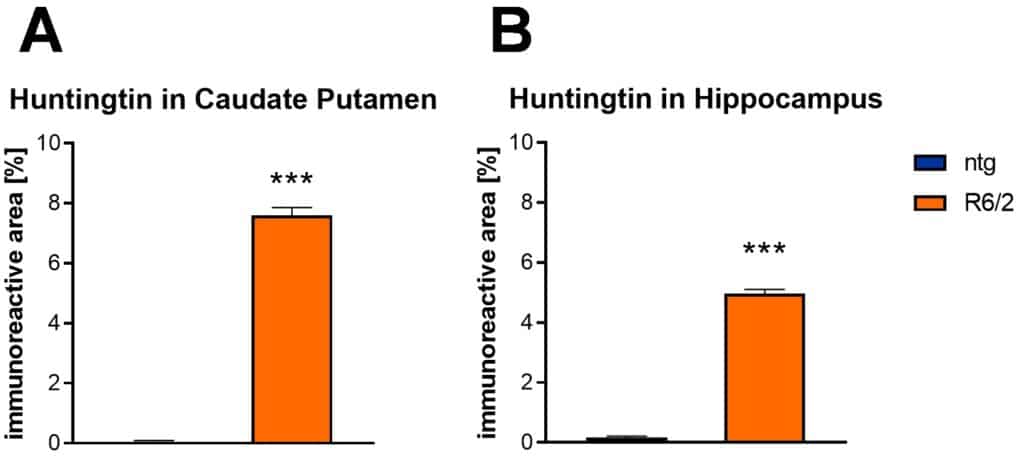
Figure 3: Quantification of Huntingtin in 12 Week old R6/2 Mice. A: Immunoreactive area of huntingtin in percent in the caudate putamen B: Immunoreactive area of huntingtin in percent in the caudate putamen. A and B: n = 4/group; Unpaired t-test. Mean + SEM. ***p<0.001.
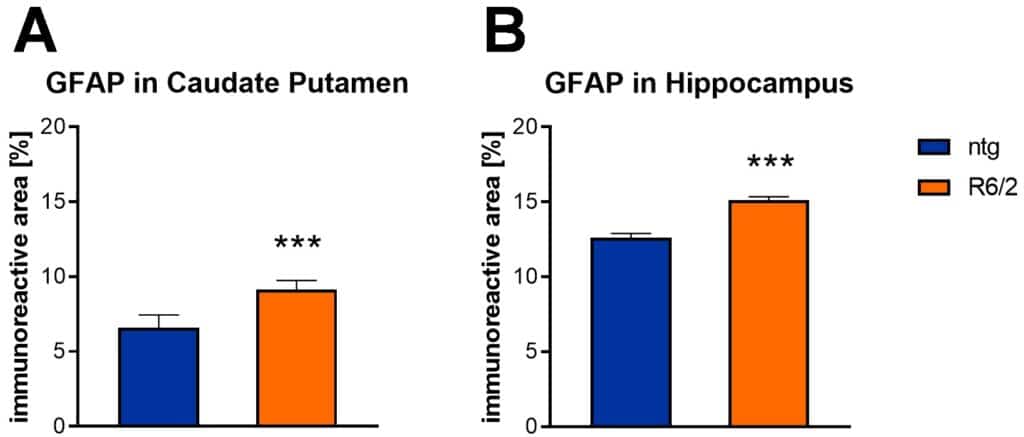
Figure 4: Quantification of Astrocytosis in 12 Week old R6/2 Mice. A: Immunoreactive area of GFAP in percent in the caudate putamen B: Immunoreactive area of GFAP in percent in the caudate putamen. A and B: n = 4/group; Unpaired t-test. Mean + SEM. ***p<0.001.