Spontaneous neuronal activity of cultivated cells is one of the physiologically most relevant read-outs related to neuronal health. Calcium concentration is widely used in neuroscience as a competent indirect reporter of neural activity, as action potential (AP) firing triggers large influxes of Ca2+ through voltage-gated calcium channels.
Utilizing IncuCyte® NeuroBurst, a genetically-encoded calcium indicator (GECI), in combination with the IncuCyte® live-cell imaging system allows to monitor morphological changes and measure neuronal activity of thousands of functional neurons inside a culture over an extended period of time.
Here we present how spontaneous neuronal activity of rat primary neurons changes in response to treatment with different reference compounds, qualifying the above-described platform as screening tool for drug discovery.
Rat primary neurons were transduced with NeuroBurst and cultivated until DIV8. Thereafter, cells were analyzed for spontaneous baseline activity in the IncuCyte® live-cell imaging system before treatments were applied. Cells were treated with:
- Picrotoxin, a non-competitive channel blocker for GABA receptor chloride channels, described to act as neuronal stimulant leading to seizure-genic activities.
- MK-801, an NMDA antagonist, acting as anti-convulsant, reducing neuronal activity.
- Forskolin, a cAMP elevating agent, described to increase neuronal differentiation, health, and activity.
The response of cells was again monitored via IncuCyte® live-cell imaging system 6, 12, 24, 48 and 72 h after application of the treatments.
All three items presented the expected results compared to the respective vehicle control (VC). While MK-801 treatment led to a reduction of active neurons, reflecting its anti-excitatory activity, picrotoxin and forskolin increased the number of active neurons (Figure 1A). Forskolin additionally impacted on the burst rate up to 72 h after treatment start (Figure 1B), while picrotoxin showed a strong and fast effect on correlation and synchronicity of neuronal activity (Figure 1C).
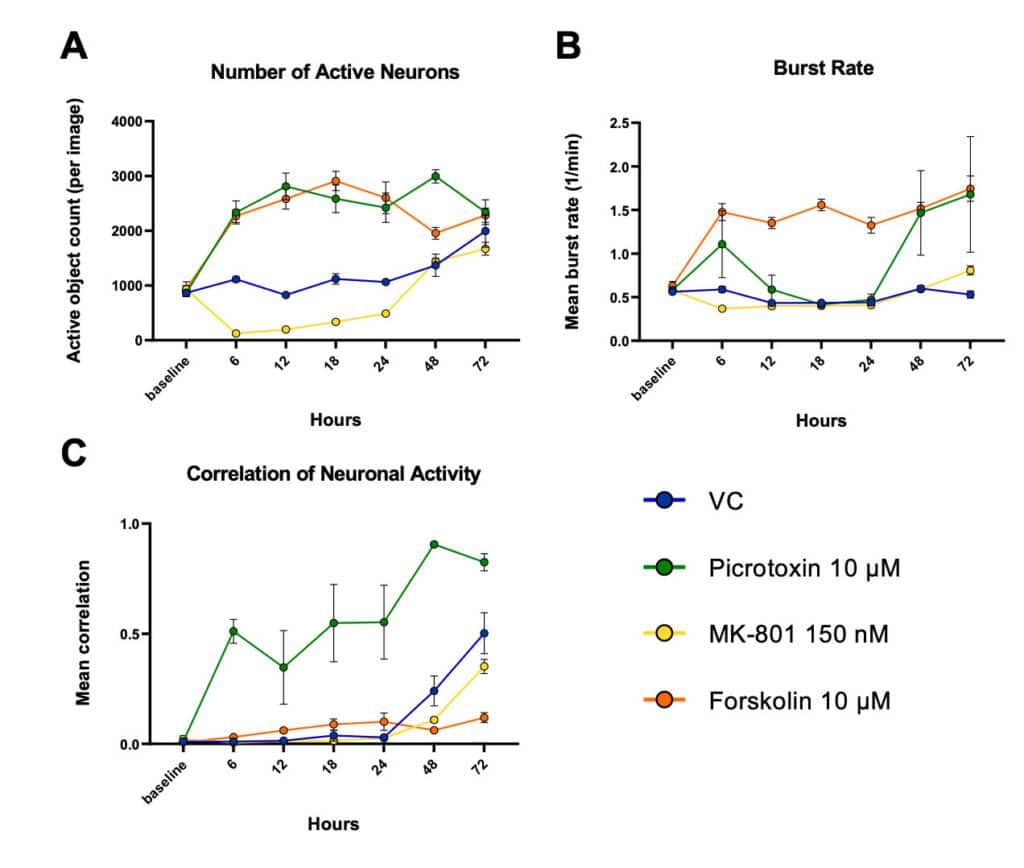
Figure 1: Monitoring neuronal activity in response to treatments with time using IncuCyte® NeuroBurst. A: Number of active neurons per well (objects that burst at least once per recording time), B: Burst rate presented as total number of bursts per minute, C: Correlation of neuronal activity as mean of all objects in relation to each other, 0 being completely random and 1 being highly synchronized. Data are generated via the integrated IncuCyte® Neuronal Activity Analysis Software Module.
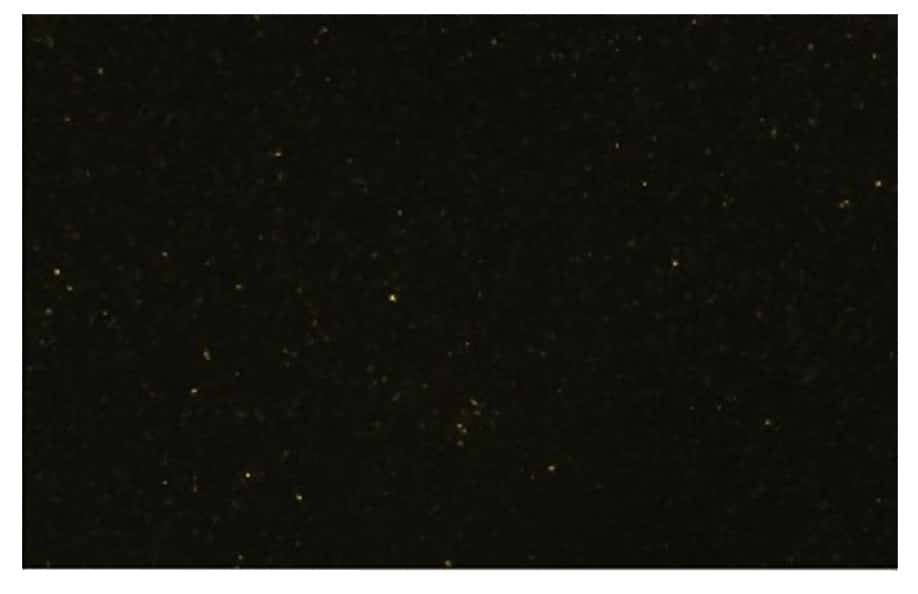
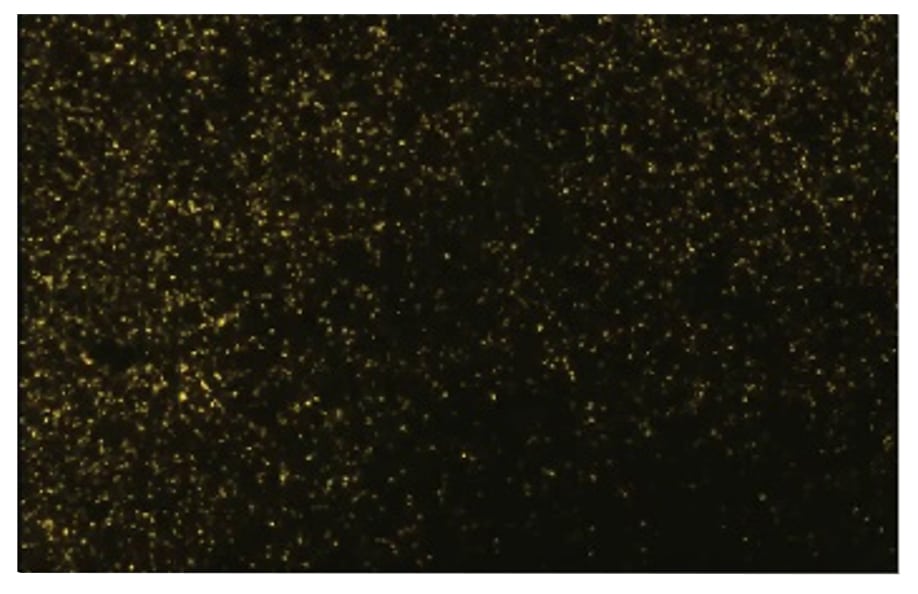

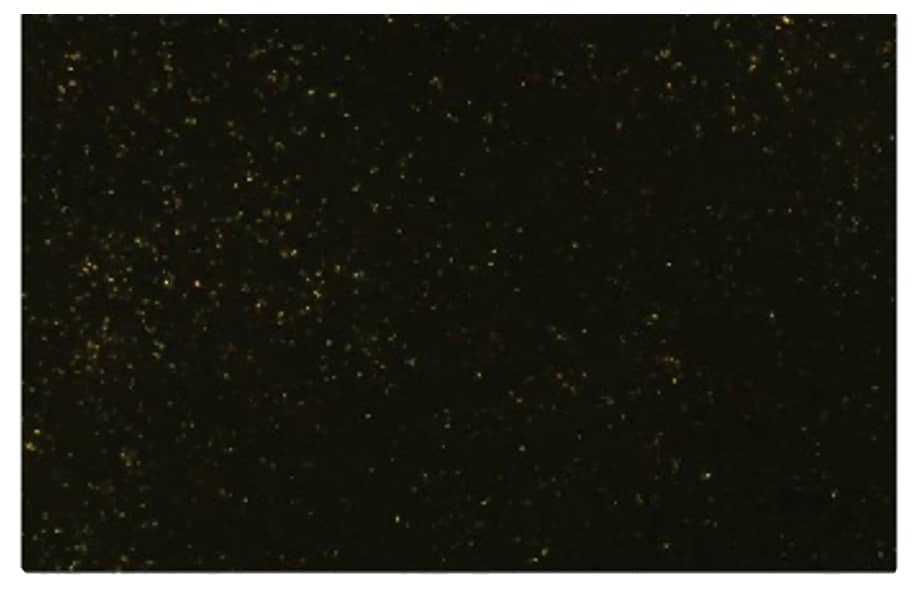
Videos: Primary rat cortical neurons seeded at 30,000 cells/well in a 96-well microplate were infected with IncuCyte® NeuroBurst Orange Reagent to monitor neuronal activity with time. Movies captured on DIV10 (48 h after treatment start; treatment with picrotoxin, forskolin, MK801 or vehicle control (VC)) reveal changes in spontaneous neuronal activity (calcium oscillations) due to different treatments.